A simple SEIR model in Jupyter
I wasn’t able to find a SEIR model I could play with in Jupyter, so I made a simple one that simulates the difference equations. You can see and download it from my github.
Quickly: the SEIR models the spread of an infectous disease by considering that a hypothetical person is in one of four mutually exclusive states. They are either Susceptible, Exposed, Infectious, or Recovered. Susceptible people become exposed. Exposed people become infectous, and recovered people are home free. This model is of course an approximation that doesn’t take into account important features of COVID-19 such as the limited duration of immunity gained from infection. Also, here we are assuming that as soon as the person is removed from the population (hospital, quarantined, etc.) they move from Infectious to Recovered, even though that person might still be sick. At the end of the simulation we add up the total number of recovered and figure out how many die via the CFR.
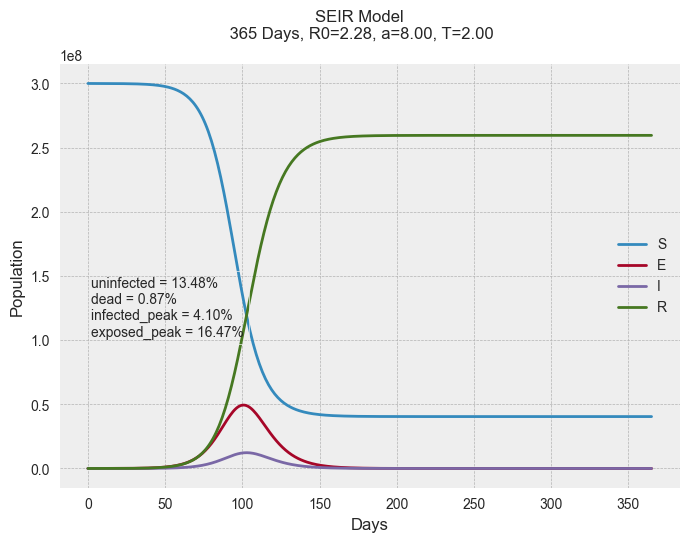
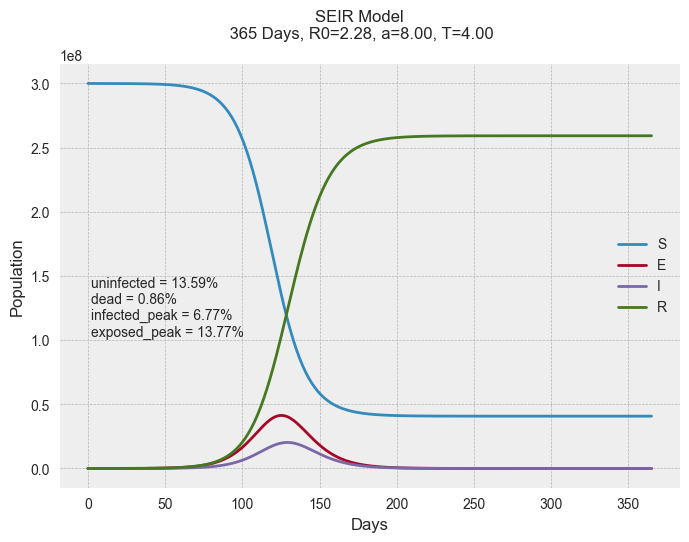
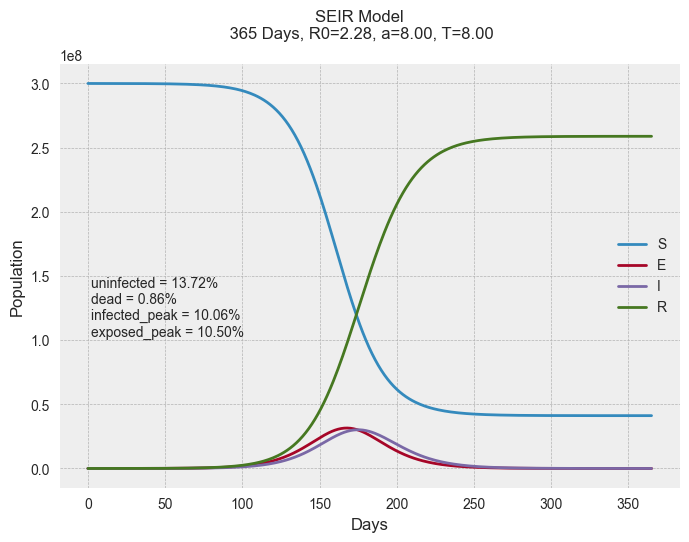
The plots below are from the notebook, and are reasonable guesses for the current situation in the US. I’m using R0=2.28, CFR=0.01, a=8 days (the time people are exposed but not infectious). The number of susceptible is 300,000,000, the number of exposed is 5000, and the number of infected is 2000.
Lately, there’s been a lot of stuff flying around about #FlatteningTheCurve. I hope this means everyone’s been watching Dr. John Campbell rather than staring at Twitter. Looking at these plots we can see why it’s so important.


The input differences between the three are in the parameter T, which is the average time (in days) that the person is infectious. The order from top to bottom is T=2 days, T=4 days, and T=8 days.
I don’t particularly think these values of T are realistic, but they illustrate “flattening the curve”. You can see the big difference in the infected_peak. For T=2 days, it is 4% of the population, while for T=8 days, it jumps to 10%. When you are multiplying by the population of the US, that’s a big number.
Based on this paper from Marc Lipsitch, there are 2.8 ER beds per 10,000 adults in the US, which comes out to something like 0.02% of the population. There are roughly 10x more beds in all the hospitals.
But you can see that why it’s so important that we reduce the amount of time that people are infectious. If 10% of the population is simultaneously infectious, then using standard assumption that only 20% need hospitalization, then you can see that we are really pushing it.
